
The MQ series are cheap gas sensors.
They are resistive electro-chemical sensors.
These sensors have a heating element and a resistance that react to gases.
Below a MQ135 sensor opened. Inside it looks like that.

To read the sensor's resistance, we measure the voltage drop of the sensor.
The method we use to measure resistance on the micro is by using the ADC, and a pull-up (or pull-down) resistor. Here http://electronics.stackexchange.com/a/70012 you can find a good explanation on the pull-down/up method on reading resistance.
Some people are asking me in my previous post about the MQ135 sensor, http://davidegironi.blogspot.it/2014/01/cheap-co2-meter-using-mq135-sensor-with.html how to obtain correlation function for other MQ series sensor, or other gas.
In this post I will explain a simple (to me) method of obtaining correlation function for any MQ series sensors that fit an exponential function.
An italian version of this article has been published in the may number of Elettronica In (http://www.elettronicain.it/) magazine.

As a reference, let's consider the MQ135 sensor (again).
We will look at the "sensitivity characteristics of the MQ-135" figure of the datasheet.
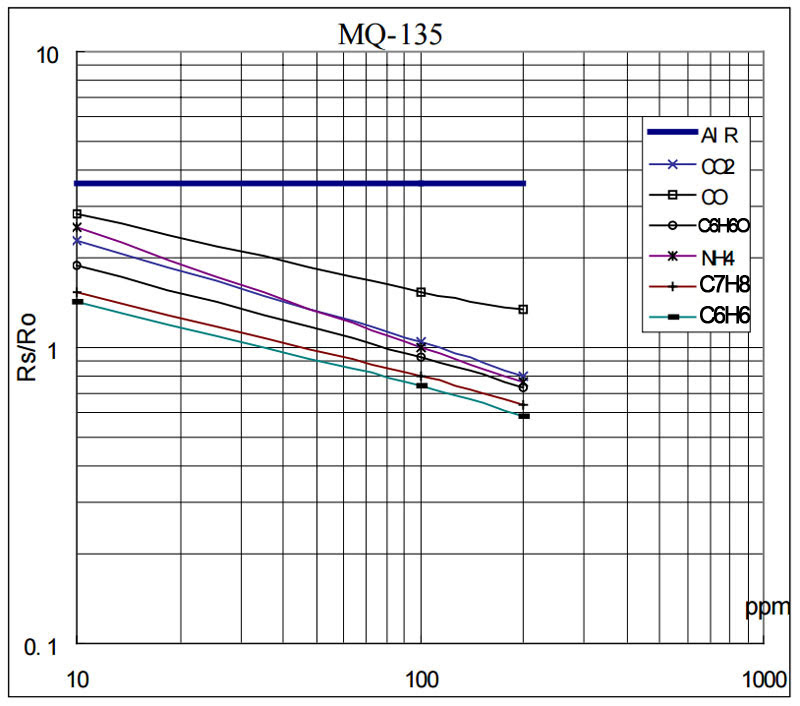
Notice that it's a log-log plot, this means that is has logarithmic scales on both axes.
Another thing to notice, is that the y-axis is for Rs/Ro, it will be much clearer if we impose ppm on the y-axis.
So as a first step, we will flip the axis.
As a reference, above we will see a flip axis example
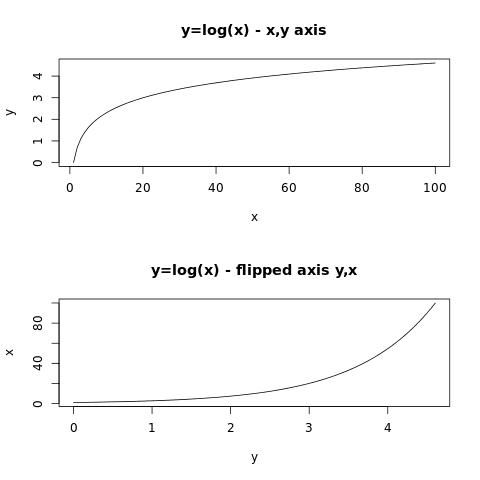
Now, let's take a look at a power function with different exponents.

Let's try to plot those function on a log-log scale.

You may notice that an exponential function flipped is again an exponential function, with different coefficient of course.
As you may see, the power function with a negative exponent looks like the one we are searching for.
Summarizing, let's take the power function y=x^-2 and plot this on the log-log scale, with a 10 multiplier

We are searching for something like:
y=a*x^b
with b<0
Now, our purpose is to find out the value of the a and b constants, starting from the datasheet figure.
We can do this by performing a nonlinear regression. Specifically we need a power regression.
First, we need to collect values from the datasheet figure.
WebPlotDigitizer is the tool we are going to use here: https://github.com/ankitrohatgi/WebPlotDigitizer. We can find few online tutorials that teach us how to use WePlotDigitalizer. I will try here to sum it up here:
1) extract the figure from the datasheet
2) load the figure on WebPlotDigitalizer
3) set axis, remember to se axis both as log
4) check out points from the curve of the gas you need to found
5) click on the view data button, and you get the points you need.
Now that we have found out the points of the curve from the datasheet, we need something to load with those points and perform a power regression.
You can use matlab or you favorite math software tools. There are also other online tools you can use to perform power regressions. Here I will use an R (ref. https://en.wikipedia.org/wiki/R_(programming_language)) script I've write.
You just have to load the points values you have found out, and launch this R script. You can also launch it on http://www.r-fiddle.org/.
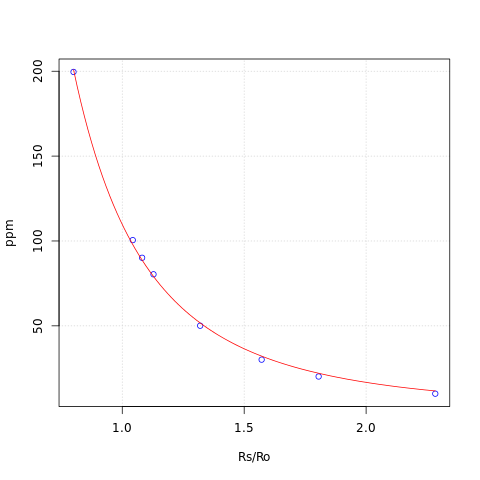
The script will find out the function coefficients (a and b), and print out the function found next to the graph points, just to check the function's accuracy.
Below the Rs/Ro vs ppm function, as seen on the datasheet.

Then the flipped function we are searching for

Then, the plot of both functions on linear scale axes:

Now we have to estimate the Ro coefficient.
Ro estimation is quite simple
We just need to solve this equation for Ro
ppm=a*(Rs/Ro)^b
Ro=Rs* sqrt(a/ppm,b)=Rs*(a/ppm)^(1/b)
note: in my library here: http://davidegironi.blogspot.it/2014/01/cheap-co2-meter-using-mq135-sensor-with.html i simply Ro as Rs*sqrt(a/ppm,b) = Rs*exp(ln(a/ppm)/b), which is the same that Rs*(a/ppm)^b.
So given the function coefficients, we have to measure the resistance of the sensor at a know amount of ppm for the gas we are investigating.
Now, just substitute the found function coefficients (a and b), the resisteance we have read (Rs in ohm) at the amount of gas (ppm) to the estimation Ro function
Ro=Rs*(a/ppm)^b
One last step is to provide the Rs/Ro limits we are going to use to validate the input for our solving function ppm=a*(Rs/Ro)^b
We know that Rs/Ro=(ppm/a)^(1/b)
So
min[Rs/Ro]=(max[ppm]/a)^(1/b)
max[Rs/Ro]=(min[ppm]/a)^(1/b)
By the datasheet figure we have to select the max and min Rs/Ro and ppm points.
Notice that we get the max Rs/Ro value for the min ppm point value.
Here you can find the R script to estimate correlation function coefficients, compute Ro, min and max Rs/Ro (input: x/y axis limits, correlation function points, resistance of the sensor in ohm at a know amount of gas in ppm).
On gist: https://gist.github.com/davidegironi/b7be6b7cace6b475dd42c48c3e62fcf4
Above an implementation of the raw value to ppm conversion, sample sketch for Arduino:
//sensor input PIN
int mqInput = A1;
//pull-down resistor value
int mqR = 22000;
//rO sensor value
long rO = 41763;
//min value for Rs/Ro
float minRsRo = 0.358;
//max value for Rs/Ro
float maxRsRo = 2.428;
//sensor a coefficient value
float a = 116.6020682;
//sensor b coefficient value
float b = -2.769034857;

void setup() {
  pinMode(mqInput, INPUT);
  Serial.begin(9600);
}

void loop() {
  int adcRaw = analogRead(mqInput);
  long rS = ((1024.0 * mqR) / adcRaw) - mqR;
  Serial.print("Rs: ");
  Serial.println(rS);
  float rSrO = (float)rS / (float)rO;
  Serial.print("Rs/Ro: ");
  Serial.println(rSrO);
  if(rSrO < maxRsRo && rSrO > minRsRo) {
 float ppm = a * pow((float)rS / (float)rO, b);
 Serial.print("ppm: ");
 Serial.println(ppm);
  } else {
 Serial.println("Out of range.");
  }
  delay(1000);
}
You can find the temperature and humidity correlation function here: http://davidegironi.blogspot.com/2017/07/mq-gas-sensor-correlation-function.html
Notes
- read risk disclaimer
- excuse my bad english